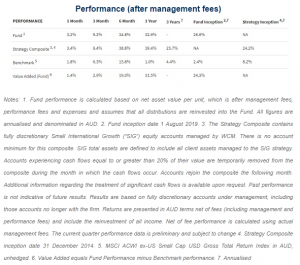
For 2020’s 3rd Quarter, the WCM International Small Cap Growth Fund (WCMS) returned 9.2%*, outperforming the benchmark MSCI ACWI ex-US Small Cap Index by 2.9%*. For the trailing twelve months, WCMS is 31.5%* ahead of the benchmark.
2020 Q3 markets confounded the pessimists yet again by delivering solid, positive returns. July and August built on the momentum from Q2, though September saw a modest pull-back. Amidst this backdrop, WCMS outperformed and expanded its YTD lead on the benchmark. Attribution analysis revealed that stock selection in Q3 was positive—whether viewed via the sector or the regional lens—and drove virtually all of our alpha. Sector allocation was about neutral, whereas regional allocation was a slight detractor. Finally, Small Cap outperformed Large Cap, Growth beat Value and High Quality topped Low Quality (“Quality” uses ROE as a proxy).
Overall, Q3 continued to demonstrate, we believe, the advantage of owning businesses with moat-aligned, adaptable cultures that are using the current environment to strengthen their competitive position.
Keeping an eye on the longer term as measured by the WCM International Small Cap Growth Strategy Composite, on which WCMS is based, the three-year excess return relative to the benchmark now stands at 21.3%(annualised)**, the five-year is 14.5% (annualised)**, and the since-inception (now 5 3/4 years) excess of the strategy is 15.9% (annualised)**.

Attribution
Sector- and region-based attribution shows a positive contribution from selection. Sector allocation was about neutral, whereas regional allocation was a slight detractor. Therefore, virtually all of WCMS’s Q3 outperformance came from our picks.
Contributors
Sector-wise, the primary allocation contributor was our overweight to Health Care (2nd best in benchmark), followed by our underweights to Real Estate and Energy (3rd worst and worst in benchmark, respectively). Sector selection was strong, with the leading contributors coming from Industrials, Financials, and Tech. By geography, our allocation overweight to Europe (2nd best in benchmark) contributed modestly. Geographic selection was strong, led by out picks in Europe and Asia/Pacific.
Detractors
The only material detractor vis-à-vis sector allocation was our underweight to Comm Svcs (best in benchmark). For sector selection, out picks in Staples and Discretionary detracted. Regionally, our allocation overweight to the Americas (worst in bench) and underweight to Asia/Pacific (best in bench) detracted. For geographic selection, our names in Africa & Middle East and the Americas detracted.
Other Factors
In Q3, the simple market factors were largely in WCMS’s favour: Growth outdid Value, Small beat Large, and High Quality outperformed Low Quality.
Comments
Global equities marked higher in Q3, extending their run since the March lows. And like your favourite song on repeat, markets continue to vote for Growth over Value.
On a related note, we would be remiss if we didn’t mention valuations—though truth be told, we do so mostly because people keep asking us about it. Objectively, an 11-year bull market run is inevitably going to drive up price tags. How could it not? But is this unwarranted?
It’s not lost on us that trailing (and forward) P/E multiples look high vs. the ten-year average—though that’s partly because the “E” is now fully reflecting COVID-19. Other measures, like free cash flow, paint a different, much more sanguine picture. And interest rates are basically zero. So it’s not clear. It rarely is, right?
Hence, the WCMS approach is to remain firmly focused on the individual holdings, and how they work together in the portfolio. Businesses that can defy the fade that’s built into conventional analysis, all collected in a concentrated portfolio with thoughtful construction, makes the valuation issue easier to navigate.
In the end, we believe WCMS is well positioned for almost any scenario that might lie ahead. And despite the strong performance of the “style”, true growth remains uncommon. That’s why we think our emphasis on positive moat trajectories, combined with our “all-weather” approach to construction, should deliver both downside protection and solid, broad-based returns.
Notes: 1. Return figures are net of fees in AUD, are subject to rounding and include the reinvestment of all dividends and income. Past performance is not indicative of future results. 2.Based on the WCM International Small Cap Growth Strategy Composite. Return figures are net of fees in AUD, are subject to rounding and include the reinvestment of all dividends and income. Past performance is not indicative of future results.
*Return figures are net of fees in AUD, are subject to rounding and include the reinvestment of all dividends and income. Past performance is not indicative of future results.
**Based on the WCM International Small Cap Growth Strategy Composite. Return figures are net of fees in AUD, are subject to rounding and include the reinvestment of all dividends and income. Past performance is not indicative of future results.
[sc name="post-disclaimer-wcms"]


